April 28, 2011

Words with meaning

Article at Slate entitled "Turning words into touchdowns", on the work of Achievement Metrics. This company takes interviews from various players and parses them, and then correlates the pattern with on- and off-field performance.  From AM's website:

Our analyses of players’ speech, arrest, and suspension data have shown that differences in players’ speech while in college can predict which players are more likely to exhibit off- and on-field behavioral problems during their professional careers.

I'm not sure whether this would work for baseball, since the players just speak in clichés. (Warning: clip includes profanities.)

-30-

April 19, 2011

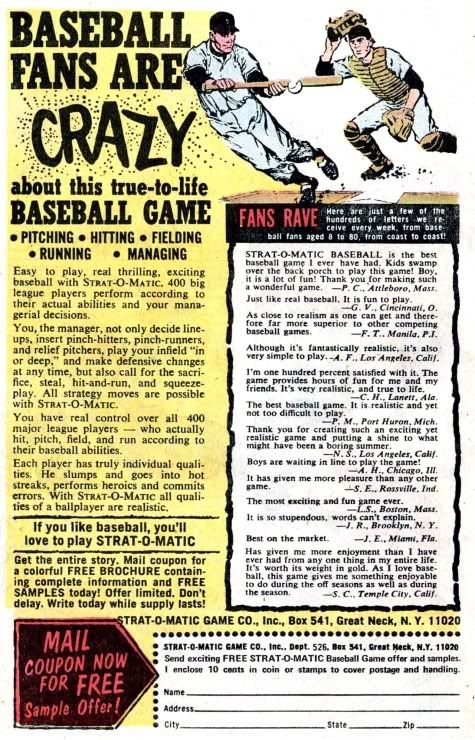
Baseball fans are crazy

Or so says this ad for Strat-o-matic, posted at If Charlie Parker was a Gunslinger...
 (Note: the main Charlie Parker page is not appropriate for at-work viewing.)


(Click the image to enlarge.)

-30-

April 12, 2011

Kicking at the darkness

Last night (2011-04-11) the Seattle Mariners pulled off a preposterous comeback, defeating the Blue Jays 8-7 after trailing 0-7 heading into the seventh inning. Other teams have had comebacks from being down by 7 runs, and pulled off comebacks in bigger games. But as Rob Neyer has pointed out, what made this so unexpected and so special was that the Mariners have been, in a word, hapless. The early part of this game was the best/worst example of their struggles.

The FanGraphs plot (chart below) follows what has become a disturbing Mariner trend this year -- the line quickly plummets to the sub-10% win expectancy range in the early innings, and slowly drifts towards zero from there. (Check out the games vs. Cleveland the day before and the home opener on 2011-04-08 for recent examples).  This time, after bottoming out at 0.3% when Luis Rodrigez (the game's eventual hero) struck out to lead off the Mariner half of the seventh inning, the WE line zigzagged its way to the other end of the scale.

Blue Jays @ Mariners, 2011-04-11 (source: FanGraphs)


For the Mariners, a second consecutive 100 loss season (which would be the third in four seasons) is not at all out of the question. But for the fans who stuck with it last night, this was one for the ages.  Or the U.S.S. Mariner game summary, quoted here in its entirety: "That was horrible, then awesome. Baseball is fun."

The title I used for this entry is a reference to Bruce Cockburn's song "Lovers in a Dangerous Time". In the article linked above, Neyer wrote "It was somebody smart, or maybe an episode of Scrubs, that said nothing worth having comes easy." The song contains the line "Nothing worth having comes without some kind of fight/Got to kick at the darkness until it bleeds daylight". In the late innings of last night's game, the Mariners showed some kick.

-30-
April 11, 2011

Social mobility toward the mean

The April 8, 2011 edition of the BBC radio program More or Less* includes a discussion of regression toward the mean in the context of social mobility stats in the U.K.  Most of the analysis has focussed on the impact social class has on long-term education outcomes. In particular, much has been made of the fact that the analysis suggests that the low ability children from high social class catch up and pass the high ability children from low social class. 


But in the broadcast Daniel Read, professor at Warwick Business School, has offered a critique (link to written version) that points out that the analysis has not accounted for "one of the oldest statistical problems of all" (the BBC's description): regression toward the mean. The source of the problem is correctly identified as the bias introduced by including only the highest and lowest performers in the groups shown in the chart. The children closest to the mean for that social class have been excluded.

Because only the extreme ends of the education outcomes tests of the two social class groups have been selected, the poorest performers naturally show improvements while the higher performers show declines. From the broadcast:
It's not that it's [the differences in outcomes between social class] all fluke. But if there's any element of luck at all -- which there surely is, because we're talking about ability tests for toddlers -- then we have to allow for what we'd expect to happen when that luck fails to last.  And what we'd expect to happen is pretty much what the graph in the government's social mobility strategy shows, which is that the next time you test the children all the high performers have dropped off. But especially the poorer kids who, remember, Nick Clegg says were disadvantaged from birth. And all the lower performers have caught up, but especially the richer kids. And then as you continue to test, the richer kids gain on the poorer kids at a very much less dramatic pace.
The easiest way to spot the regression towards the mean? The enormous change from the first to the second measurement, as much of the selection bias at the first measurement point disappears. The high and low performers were selected not on the basis of their long-term outcomes, but on the results of the first test. In subsequent tests the children in these extreme cases will move toward the mean, and closer to their "true talent".

Accounting for regression toward the mean does not mean that social class doesn't have a relationship with education outcomes. But accounting for the regression toward the mean would moderate the magnitude of the difference between the two social classes.

*The linked page has a text summary of the program, a copy of the chart in question, streaming audio of the program, and links to the podcast and supporting documents. The item begins at roughly 17' 25" of the podcast.

-30-

April 10, 2011

Meaningless numbers

There's been plenty of chatter on the sabermetric blogs lately about the meaningless stats bandied about by broadcasters during the early stages of the season.  The best way I've seen the validity of these numbers debunked is on Jeff Sullivan's post on the Indians-Mariners game at Lookout Landing (on SB Nation):

In the bottom of the first, the broadcast flashed a Justin Masterson [the Indians' starting pitcher] stat graphic showing his lefty/righty splits on the season. After one game. The only thing I wish is that they would've shown his home/road splits instead.

-30-

April 8, 2011

On pace for a 162 loss season!

Two days ago I responded to an on-line article about the Orioles' 4-0 start to the season, pointing out that it's not at all surprising -- using the laws of binomial probability -- to see three of the 30 MLB teams at 4-0 to start the season.

What I didn't mention were the teams that started the season on a losing streak. And now, heading into this weekend's play, the 0-6 Red Sox and Rays that are getting the attention of the punditocracy.  For the Red Sox, it's the poorest start since the 1945 season, and the Rays haven't ever gone 0-6 to start the season in their comparatively short history.

Some writers have acknowledged the probability and the history of being 0-6:  Dave Cameron at FanGraphs writes "Is it time to panic in Boston?", and Cliff Corcoran at S.I.'s piece is "It's still early, but history is against winless Red Sox, Rays and Astros" (which was written before yesterday's games, when the teams were 0-5).

An entirely different view can be found Baseball Prospectus, where Steven Goldman uses the 1987 Brewers, who went 13-0 and then 20-3 (Goldman writes, "on pace for a 141 win season") before hitting a 12 game losing streak, and the opening sequence of Tom Stoppard's existentialist play Rosencrantz And Guildenstern Are Dead to suggest that sometimes things operate outside the laws of probability.

(Watch the scene in question, from the 1990 film with Gary Oldman and Tim Roth as the title characters.)

In the play, the characters are faced with a preposterously long string of coin-flips that land heads. This leads Guildenstern to say "A weaker man might be moved to re-examine his faith, if in nothing else at least in the law of probability."

Even though the two teams are 0-6, the weakness of my faith in the laws of probability is not yet tested.

-30-


April 7, 2011

Gelman on baseball

Andrew Gelman has published a few blog articles lately that hit on baseball.

First up, "Bill James and the base-rate fallacy", where he points out a flaw in James' reasoning that arises from the "availability heuristic".

Second, at The Statistics Forum, a comparison of predicting future performance at a significant transition point in "Minor-league Stats Predict Major League Performance, Sarah Palin, and Some Differences Between Baseball and Politics".

I don't have anything to add, other than to say it's encouraging to see one of the best statistical thinkers in the academy using baseball as a point of reference.

-30-

April 6, 2011

On pace for a 162 win season!

Only at the beginning of the season would a four-game winning streak get you an article on S.I.

The probability of a true .500 team playing four games against other true .500 teams and winning them all is 6.25% -- or roughly 2 out of 30. In other words, at this point in the season we could realistically expect two teams to be at 4-0.  Once we consider that in real life teams are not so perfectly matched, thus raising the odds of the more powerful team being successful in all four games, the fact that there are three teams with 4-0 records (Orioles, Reds, and Rangers) isn't a surprise.

The only surprise in all of this is that the Orioles (widely touted to finish last in the A.L. East) swept the Rays in a three game series in Tampa Bay and then went on to beat the Tigers at home in their fourth game of the season. But then again, the probability of a .400 team going 4-0 against a .500* team is just under 3%.  Not very good odds, but something we would expect to see on occasion.

(Shout out to Tango, who raised the "on pace" problem a couple of days ago, and The Book readers who added various lucid and perceptive comments, including an XKCD cartoon. You can never go wrong using an XKCD cartoon to illustrate your point.)

Update: the New Utosky Bolshevik Show takes the Red Sox 0-3 start as its jumping off point for a post titled The Red Sox Aren't Doomed, demonstrating the same thing I did but with graphs and Python script.  Score one for the NUBS.

* Changed from ".600".  Comment #1 below was generated because of this typo; #2 is my detailed response.

-30-